

By Kyrylo Shevchenko Photo by cottonbro studio
As Ukraine enters autumn 2025, its economy teeters on the brink of a new macroeconomic shock, with its recovery potential exhausted. The low-base effect from 2022, which drove record GDP growth in Q2 2023 (+19.5% year-on-year), has fully dissipated. Economic momentum began to slow by late 2023, and by Q4 2024, the economy had slipped into recession (–0.1% year-on-year).
The Economy Before and During the Full-Scale War
Before Russia’s invasion in February 2022, Ukraine’s economy showed relative stability. In 2021, real GDP grew by 3.4%, reaching nearly $200 billion in current prices. The economy was structured as follows:
- Industry: 23% of GDP
- Agriculture: 10%
- Construction: 6%
- Services (including trade, transport, IT, and finance): 61%
The invasion triggered a severe shock in 2022:
- GDP contracted by 29.1%.
- Up to 25% of industrial capacity, particularly in metallurgy and machinery, was lost.
- Maritime logistics, which handled 70% of exports, came to a near standstill.
- Over 6 million people fled the country, exacerbating labor shortages.
Recovery began in 2023–2024, but structural imbalances persisted:
- 2023: GDP growth reached +5.3%, driven by the low-base effect, over $40 billion in foreign aid, and government spending.
- 2024: Growth slowed to +4.1%, signaling the exhaustion of post-shock recovery momentum.
Structural challenges have become increasingly evident:
- Exports rely heavily on agriculture, while metallurgy and machinery continue to decline.
- Fixed capital investment remains critically low at 6–7% of GDP, compared to the 15% needed for sustainable growth.
- Approximately 55% of the state budget is financed by foreign donors.
In 2025, growth has slowed to a statistical margin of error: Q1 (+0.9%), Q2 (+0.6%), with forecasts indicating a potential contraction by autumn. Industry is in steady decline (–5% year-on-year, or 11–12% per CES/Info Sapiens estimates, as official State Statistics Service data remain unpublished during wartime).
Exports are weak (–5% year-on-year), with a significant drop in grain exports (–24%, or –$3.5 billion) due to reduced acreage, lower yields, and adverse weather. Growth in machinery exports (+11%, or +$1 billion) fails to offset these losses. Meanwhile, imports of electrical equipment surged by +68% (+$4.4 billion), highlighting domestic industry’s inability to meet energy and defense needs.
Construction is also contracting, with military and infrastructure projects unable to compensate for the decline in residential construction, further dragging down metallurgy and cement production.
Stagflation has become the new norm. The GDP deflator in Q1 2025 reached 16.9%, reflecting weak growth combined with high inflation. Public debt has hit 100% of GDP (≈$185 billion), with $139 billion external and $46 billion domestic. Debt servicing is temporarily eased by grants and concessional loans (≈$40 billion annually), but this underscores the economy’s dependence on external transfers.
Western financial support is no longer sufficient. The latest EU tranche of €4 billion was cut by €1.5 billion due to unmet reform requirements (ARMA, VAKS, decentralization). Total aid under the Ukraine Facility since March 2024 amounts to €22.7 billion (≈60% of the program’s resources), but this falls short of needs. The 2026 budget assumes ongoing conflict, cementing fiscal dependence.
The defense industry is the sole growth sector, tripling in size since 2022 (from $3 billion to $9 billion) and contributing one-third of real GDP growth in 2024. Expanding the “Danish model” (allied procurement of Ukrainian weapons) remains one of the few viable strategies for industrial revival.
Autumn 2025: Warning Signs of a Macroeconomic Collapse
GDP growth in the first half of 2025 was a mere +0.8%, with the economy still 23% below pre-war levels. The trade deficit reached –$24.5 billion from January to July. National Bank of Ukraine (NBU) reserves are shrinking due to interventions (–$20.7 billion over seven months). The budget deficit is ≈30% of revenues, with 60% financed externally.Sectoral Performance (H1 2025):
- Industry: Down over –5% year-on-year, with:
- Electricity: +6.8% (grid and generation recovery)
- Machinery: +7.4% (defense orders)
- Mining: –4.2%
- Metallurgy: –8% (falling demand and export channels)
- Agriculture: –3.7% year-on-year, with grain losses of –24% (–$3.5 billion) due to reduced acreage and poor weather.
- Construction: Nominally +2.3%, driven by defense and infrastructure projects, but residential construction has collapsed, pressuring metallurgy and cement.
- Transport and Logistics: –1.5% year-on-year, constrained by port and railway limitations.
- Trade: +4.9% year-on-year, driven by imports.
- IT Sector: +5.6% year-on-year (below pre-war 10–12%).
- Financial Sector: +3.2% year-on-year, driven by bank profits from government bonds and deposit certificates.
- Unemployment: ≈15%.
- Exports: –5% year-on-year.
- Energy and Equipment Imports: +68% (+$4.4 billion).
- Trade Balance: Forecasted at –$52 billion for 2025.
- NBU Reserves: $43.03 billion as of August 1; net sales of $3.457 billion in July, $20.7 billion over seven months; import coverage at 4.7 months.
- Public Debt: 100% of GDP, a critical threshold.
- GDP Growth: Q1 2025 (+0.9%), Q2 (+0.6%), with a potential recession looming in autumn.
These figures highlight structural stagnation, despite superficial statistical growth. Weak exports (–5% year-on-year), particularly in agriculture (–$3.5 billion), and soaring electrical equipment imports (+68%, +$4.4 billion) underscore domestic industry’s inability to meet energy and defense demands. Machinery export growth (+11%, +$1 billion) is positive but insufficient to offset agricultural losses. Construction, driven by military and infrastructure projects, no longer propels the economy as it once did through residential development.
External Sector and Balance of Payments: Record Trade Deficit
In July 2025, the trade deficit hit a record –$4.37 billion, driven by a +28% year-on-year import surge and declining export revenues. For January–July 2025:
- Goods and Services Exports: $26.53 billion
- Goods and Services Imports: $51.05 billion
- Balance: –$24.52 billion
Trade Balance Trends During the War:
- 2022: –$13.5 billion (low imports due to disrupted logistics, exports supported by the grain corridor)
- 2023: –$22.9 billion (recovery of fuel and equipment imports, declines in metallurgy and machinery)
- 2024: –$31.8 billion (rising energy and military imports, port disruptions)
- 2025 (NBU forecast): –$52.2 billion, the worst result of the war.
Monthly Trade Dynamics (2025, Goods + Services, $ billion):
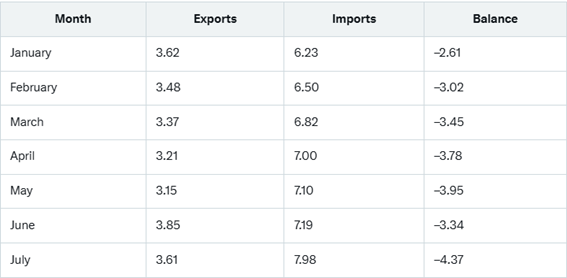
The deficit is accelerating:
- Q1: Average monthly deficit of –$3.03 billion
- Q2: –$3.69 billion
- July: –$4.37 billion
If this trend persists, the annual deficit could exceed $52 billion.
Export Structure (January–July 2025):
- Agriculture: 43%, down –8% year-on-year, with grain exports falling –24% (–$3.5 billion).
- Metallurgy: 18%, down –12% year-on-year.
- Machinery: 6%, up +11% year-on-year (+$1 billion), insufficient to offset agricultural losses.
- Chemicals and Pharmaceuticals: Moderate growth of +4%.
Import Structure:
- Fuel and Energy: 26%, up +35% year-on-year.
- Machinery and Equipment: 23%, up +42% year-on-year (military and energy equipment).
- Food: 8%, up +18% year-on-year.
- Other Goods (including consumer goods): Up +19% year-on-year.
The +68% surge in electrical equipment imports (+$4.4 billion) highlights a critical weakness: domestic industry’s inability to meet defense and energy needs.
Services Balance:
- Services Exports (including IT): $5.8 billion (+3% year-on-year).
- Services Imports: $8.9 billion (+12% year-on-year).
- Balance: –$3.1 billion.
The trade deficit is financed by donor tranches and NBU interventions, which totaled –$20.74 billion from January to July 2025. External aid amounted to $22.5 billion, with $6.9 billion from migrant remittances, though the latter is slowing.
Ukraine enters autumn 2025 with a record trade deficit that is worsening monthly. Without external aid and interventions, the currency market would collapse within a quarter.
Why the Situation Is Critical:
- Stagflation: Weak growth with inflation at ≈14% (GDP deflator 16.4%).
- “Managed Flexibility”: Effectively manual reserve depletion to stabilize the exchange rate.
- Banking System: Primarily serves the state, with private-sector lending stagnant.
- Budget Dependency: Any delay in EU/IMF tranches would trigger an immediate crisis.
Outlook for Autumn 2025
The combination of weak growth, inflationary pressures, and structural unemployment (≈11–12% per CES/Info Sapiens) signals an impending economic shock. The Q1 2025 GDP deflator of 16.9% confirms stagflation: low growth paired with high prices. Ukraine’s recovery momentum from 2023 is exhausted, and without new growth drivers, the economy risks entering a new recessionary cycle by autumn 2025, exacerbated by potential harvest failures, rising energy imports, or aid delays.
DONORNOMICS: My New Term for the Ukrainian Economy
A new type of economy has taken shape in Ukraine — and the most appropriate term for it is Donornomics. Read more!
Photo by Pexels
Urgent Steps to Avoid a Crisis:
- Float the Exchange Rate: A devaluation shock would curb imports, boost exports, and preserve reserves.
- Launch Long-Term Refinancing Operations (LTRO): 5–7-year programs with state guarantees to revive business lending.
- Increase Capital Investment: Raise spending on energy, transport, and industry to 2–3% of GDP.
- Prepare Debt Restructuring (LMO-2): Act proactively to avoid a crisis in 2026–2027.
However, implementing these measures requires political will, which is currently lacking. Ukraine is thus balancing on the edge of a macroeconomic collapse.
Scenarios for 2026–2027
- Optimistic (Floating Exchange Rate):
- The hryvnia is allowed to float, causing an initial shock (exchange rate exceeding 50–55 UAH/USD, inflation spiking to 20%+).
- Benefits: Reduced imports, lower currency demand, competitive exports, and reserve stabilization.
- By late 2026, the exchange rate stabilizes, inflation falls to 8–10%, and exports drive growth.
- Baseline (Continued “Managed Flexibility”):
- The NBU maintains manual exchange rate smoothing, burning $3–3.5 billion monthly.
- Consequences: Reserves drop to $35–40 billion in 2026 and $30–35 billion in 2027; trade deficits exceed –$40 billion annually; the economy remains donor-dependent, vulnerable to aid disruptions.
- Crisis (Aid Disruption and Winter Imports):
- Aid falls by 25–50%, with interventions rising to $4–4.5 billion monthly.
- Consequences: Reserves fall below $24 billion (three-month import coverage) in 2026; exchange rate spirals to 60–70 UAH/USD; inflation hits 20–25%; GDP contracts by –3 to –5%; forced currency restrictions and debt restructuring ensue.
Macroeconomic Indicators by Scenario:
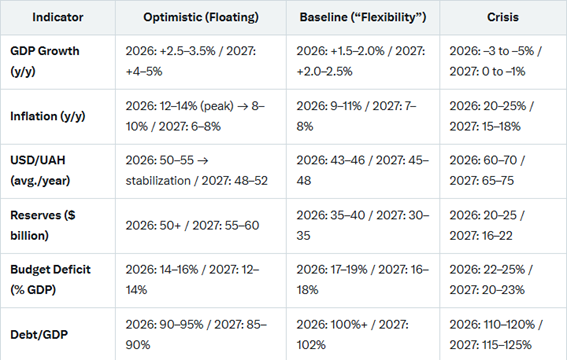
A floating exchange rate, though painful, could break the cycle of reserve depletion, reduce imports, stimulate exports, and preserve reserves. However, the NBU’s lack of independence from the President’s Office makes this unlikely. The baseline or crisis scenarios—continued reserve erosion or a full-blown currency crisis—are more probable.
About the Author

| Kyrylo Shevchenko is a devoted father, proud Ukrainian who was the Chief of the National Bank of Ukraine (July 2020-October 2022). A Banker/Financier with 30 years of experience, Kyrylo maintains his cool amongst immense pressure and challenges. He successfully managed war time crisis during the February 2022 Russian-Ukraine conflict, while sustaining banking system in an interrupted mode. |